Permanent archive
Preserve repository traffic beyond GitHub’s rolling retention window.
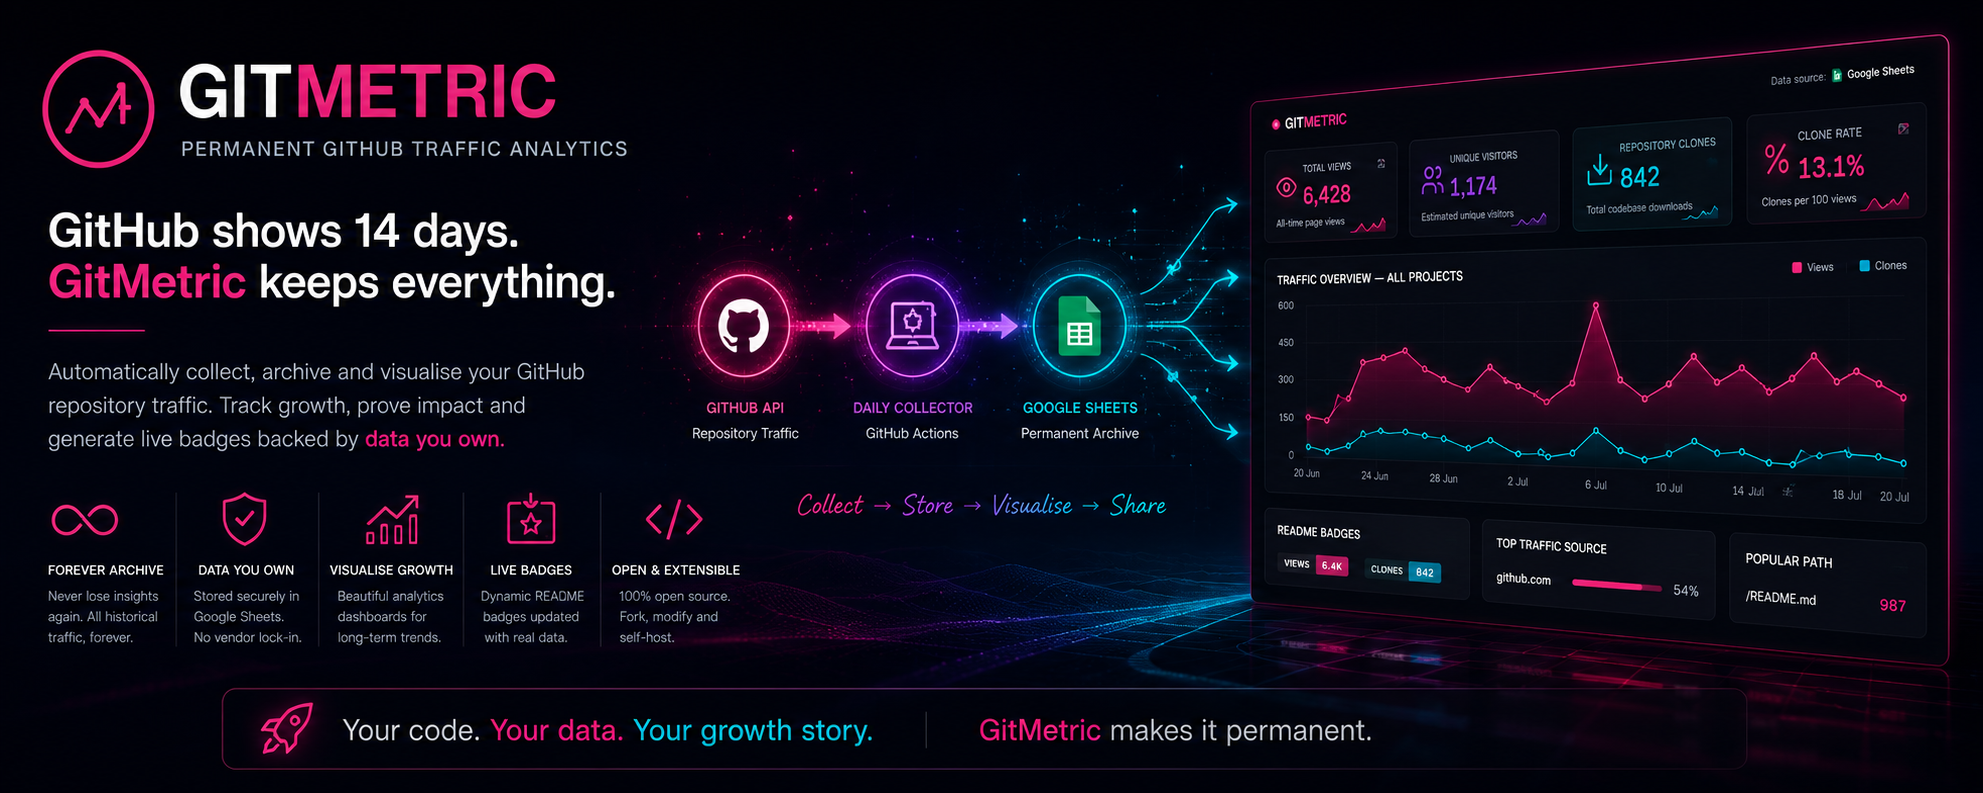
Self-hosted GitHub portfolio analytics
GitMetric is a self-hosted GitHub portfolio analytics platform designed to permanently archive repository traffic data, visualise long-term performance and generate live README badges backed by a Google Sheet.
The system is built around the principle of proportional architecture: using the lightest reliable infrastructure that solves the problem while maintaining a user-owned, transparent and cost-effective footprint.
Introduction
For a modern developer, a public repository is far more than a collection of scripts. It is part of a professional identity, a record of technical judgement and often the clearest public evidence of how someone approaches real problems.
Yet most public repositories have a blind spot. GitHub can show that a project exists, what code it contains and how many people have starred it, but the long-term story of how that project was discovered and used is much harder to retain.
Stars are useful, but they are only one signal. They do not show how many people viewed a repository, how many visitors were unique, how often the codebase was cloned or which referring sites sent people to it. Those metrics are available through GitHub traffic insights, but only for a rolling fourteen-day period.
Without an external persistence layer, the project’s early traction, launch spikes and long-term growth pattern quietly disappear. A repository may have been widely viewed, shared or cloned, but months later there is no historical record left to prove it.
GitMetric exists to close that gap. It captures the authenticated traffic data GitHub makes available to repository owners, preserves it in a user-owned Google Sheet and turns it into a long-term analytics layer for a developer portfolio.
Preserve repository traffic beyond GitHub’s rolling retention window.
Store raw historical records in infrastructure controlled by the developer.
Compare views, visitors, clones, cloners, referrers and activity over time.
Publish edge-cached repository metrics without exposing the persistence layer.
The 14-day disappearing act
GitHub exposes detailed traffic data, but the available history is temporary. Once a record leaves the rolling window, it is no longer available through the traffic interface or API.
GitHub traffic insights include repository views, unique visitors, clones, unique cloners, referring sites and popular content paths. These are some of the most useful signals available to a repository owner because they show more than passive approval.
A view shows that someone opened the project. A unique visitor helps separate repeated browsing from distinct interest. A clone suggests that someone downloaded the codebase, often to inspect it locally, test it, learn from it or integrate it into their own work.
The problem is retention. GitHub only exposes a rolling fourteen-day history for this traffic data. If a project launches, receives a burst of attention and then sits untouched for several weeks, that early traffic pattern disappears unless the owner has archived it elsewhere.
If the data is not captured while it is available, the project’s early growth story becomes impossible to reconstruct later.
This is not just a reporting inconvenience. It affects the ability to understand which releases gained attention, which posts generated interest, which repositories are steadily growing and which projects are attracting people who actually clone the code.
Temporary history
A short rolling window cannot show the multi-month or multi-year trajectory of a project.
Delayed publication
GitHub aggregates traffic asynchronously, so the newest daily counts may change after they are first returned.
Lost context
Releases, social posts and community mentions cannot be correlated with historical traffic once those records disappear.
Why ordinary profile counters are not enough
Third-party counters can be useful decoration, but they do not replace authenticated traffic information from GitHub.
Many developers add a profile counter or README badge to make activity visible. These tools usually work by loading a remote image whenever the README is displayed. The provider increments a number and returns an updated badge.
That approach has three important limitations.
A counter begins at zero when it is installed. It cannot recover traffic earned before the badge existed and it cannot reconstruct a launch period that has already disappeared from GitHub.
Standard counters can increment when the same page is refreshed repeatedly. They measure image loads, not necessarily meaningful, authenticated engagement.
A README counter cannot see repository clones, unique cloners, referring sites or popular content paths. It records one narrow signal and misses the rest of the repository journey.
A page view shows curiosity. A clone shows intent.
The platform
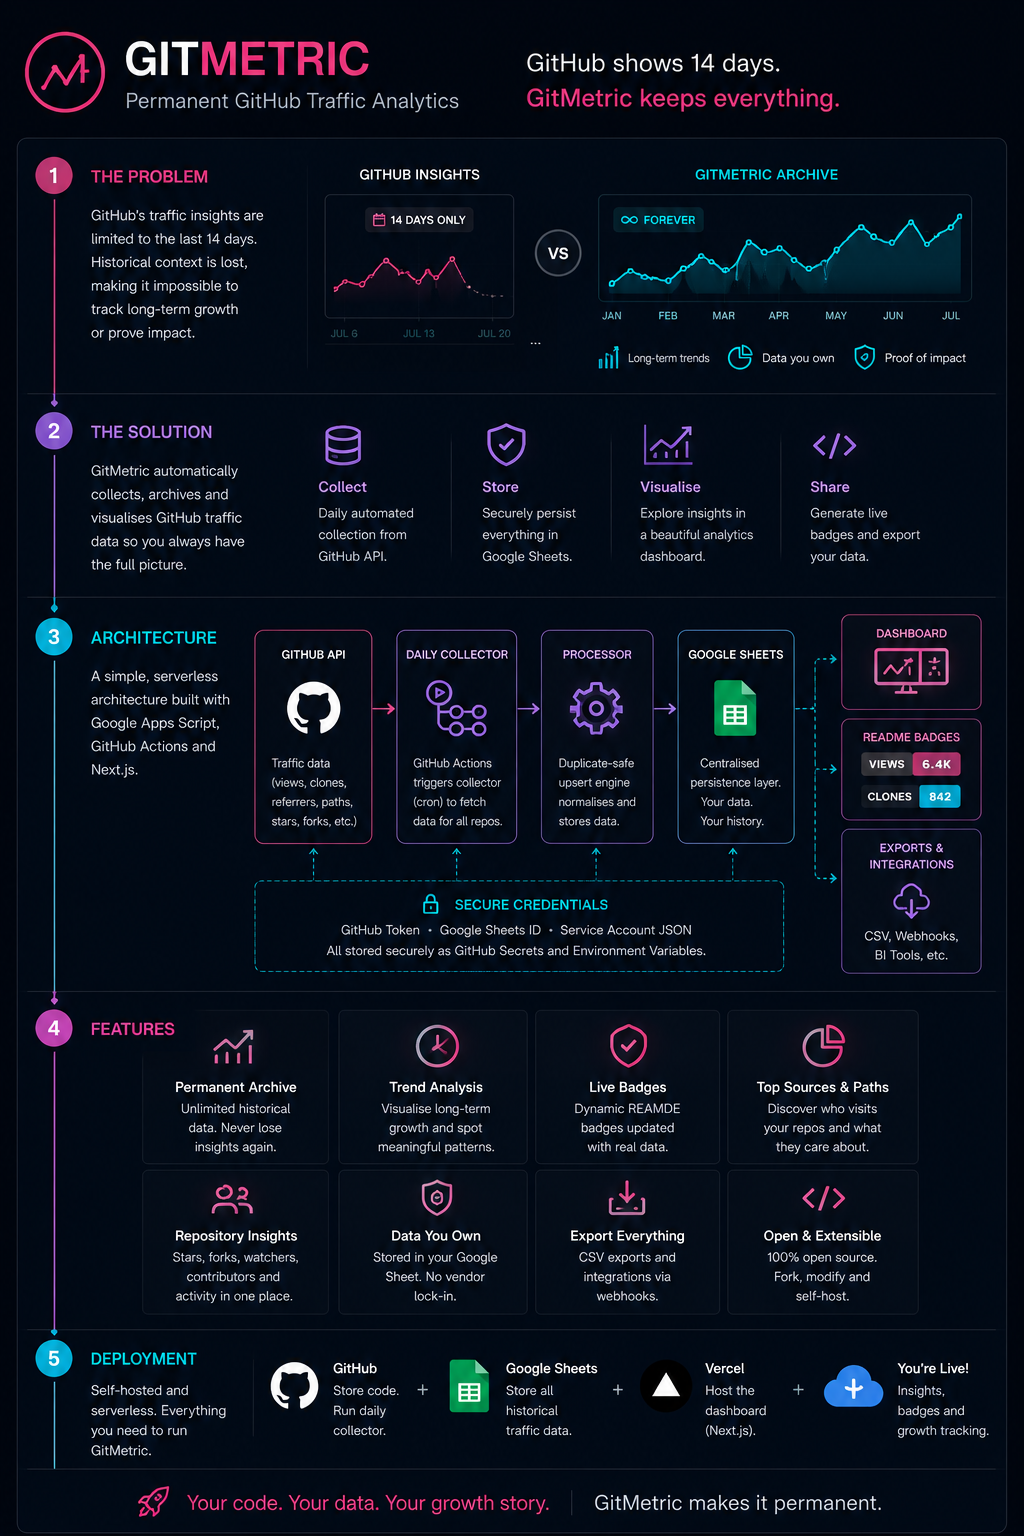
GitMetric combines a scheduled collector, a permanent persistence layer, an analytics dashboard and a badge API into one self-hosted platform.
The backend collector runs daily through GitHub Actions. It retrieves the available traffic history for every tracked repository, reconciles that history with records already stored in Google Sheets and updates or appends rows as required.
The frontend dashboard reads the preserved archive and turns it into a portfolio-wide overview. It also provides individual project views where repository traffic can be explored alongside stars, forks, contributors, commits, pull requests, issues, referring domains and popular content paths.
The same persisted data can be used to generate live SVG badges for README files. Those badges are cached at Vercel’s edge so visitors receive a fast response without creating repeated direct reads against the Google Sheets API.
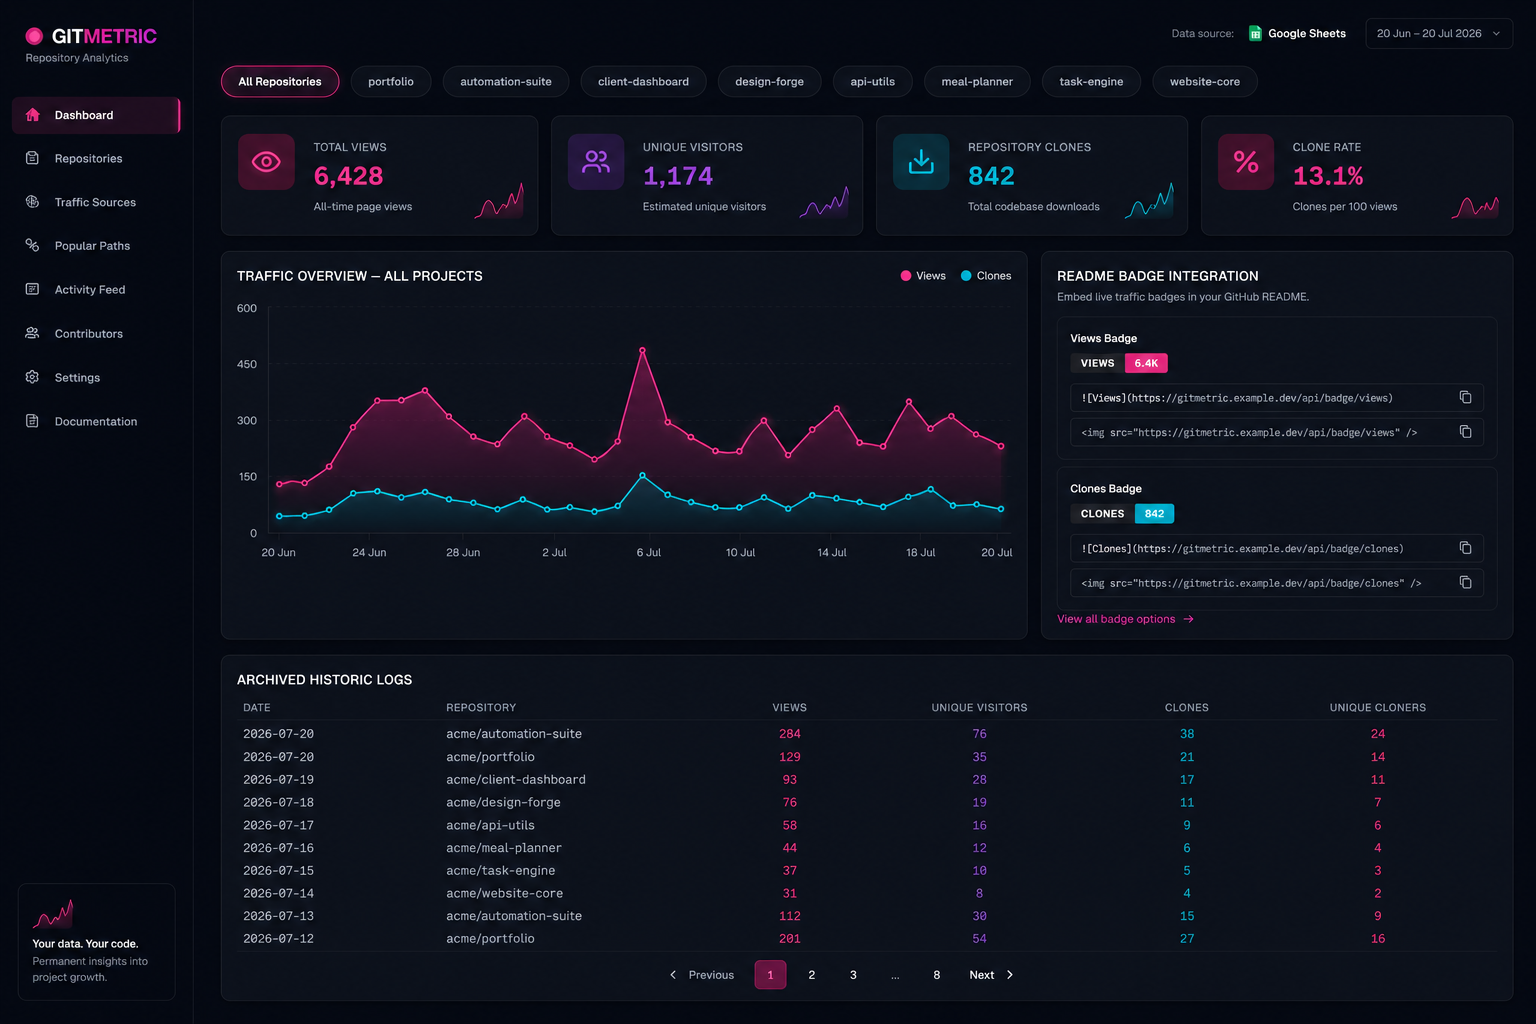
Compare all tracked repositories from a single dashboard and see which projects are gaining interest over time.
Inspect the permanent daily archive rather than relying on a temporary fourteen-day snapshot.
Move between portfolio totals and individual repositories without opening separate tools.
Generate repository-specific SVG metrics that can be embedded in GitHub READMEs.
System architecture
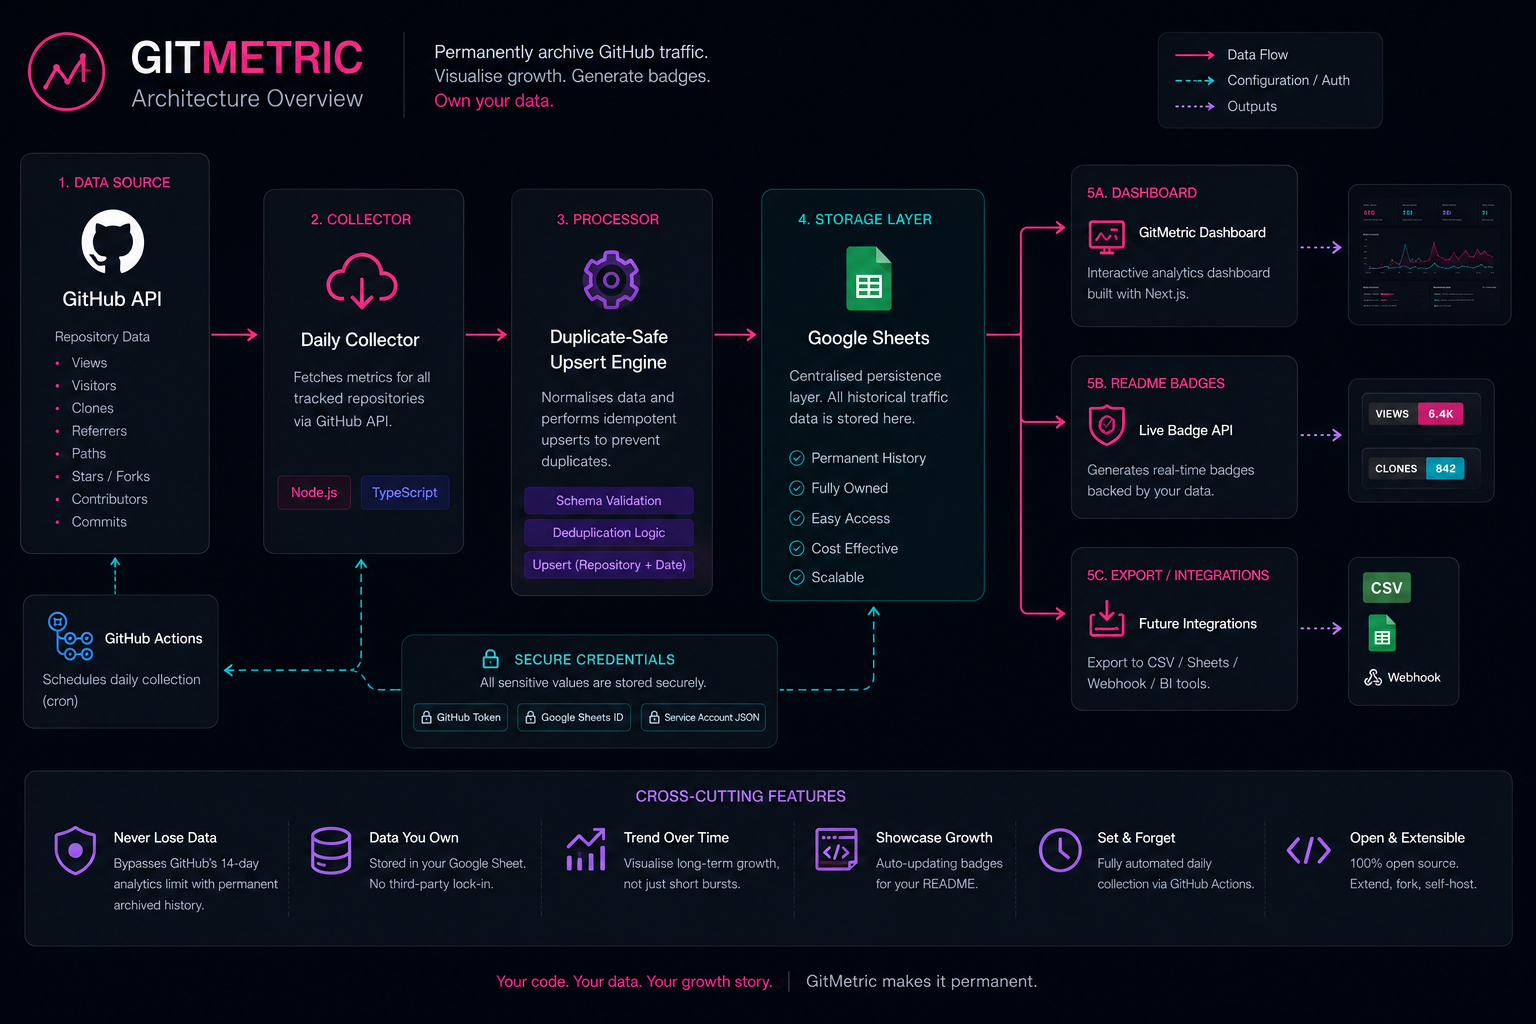
GitMetric separates data collection, persistence and presentation so each part has a clear responsibility and can be replaced independently if the project grows.
GitHub acts as the source of truth for the repository traffic data made available to repository owners. The collector retrieves views, unique visitors, clones, unique cloners, referring sites and popular paths from the available rolling window.
A scheduled workflow runs the collection process once per day. GitHub Actions is a natural fit because the automation lives beside the source code, uses repository secrets and provides a visible run history without requiring a permanently running server.
The collector does not blindly append every API response. It checks whether a row already exists for the same repository and date, then updates the existing row or appends a new one.
The developer’s own spreadsheet becomes the permanent archive. It stores the daily traffic rows in a transparent format that can be inspected, exported, audited or connected to other tools.
The frontend transforms the raw archive into charts, summary metrics, project views and repository intelligence. Server-side routes keep credentials away from the browser.
Public README badges are generated dynamically and cached through Vercel’s CDN edge. This improves response speed and reduces repeated reads against Google Sheets.
Collector mechanics
The upsert engine is the persistence coordinator that keeps the archive accurate while GitHub’s recent traffic figures are still settling.
GitHub aggregates and publishes traffic metrics asynchronously. This can introduce a delay of approximately twenty-four to forty-eight hours before recent totals are complete. A value returned today may therefore be revised when the same date is requested again tomorrow.
To handle that behaviour, GitMetric does not fetch only the newest day. Every scheduled run retrieves the full trailing fourteen-day window for each tracked repository.
The engine then treats the combination of repository and date as the unique record key.
Repository + date already exists
If the Google Sheet already contains a row for that repository and date, GitMetric replaces the stored metrics with GitHub’s latest available values.
This automatically backfills delayed traffic and captures corrections made while the date remains inside GitHub’s rolling window.
Repository + date does not exist
If no matching record exists, the collector adds the new daily row to the end of the archive.
The date enters the permanent history without creating a second copy of any record already stored.
By combining updates and inserts, the collector becomes idempotent. It can run more than once a day, restart after a failure or repeat the same window without producing duplicate records.
This behaviour is more important than the particular storage technology. The same reconciliation strategy could be used with PostgreSQL, SQLite, JSON or another persistence layer. In GitMetric, Google Sheets is simply the destination chosen for this project’s scale and operating model.
The result is a continuous archive that is duplicate-free, automatically backfilled, safe to rerun and easy to audit.
Repository detail
GitMetric does not stop at a combined dashboard. Each repository has a dedicated view that brings historic traffic and live project context together.
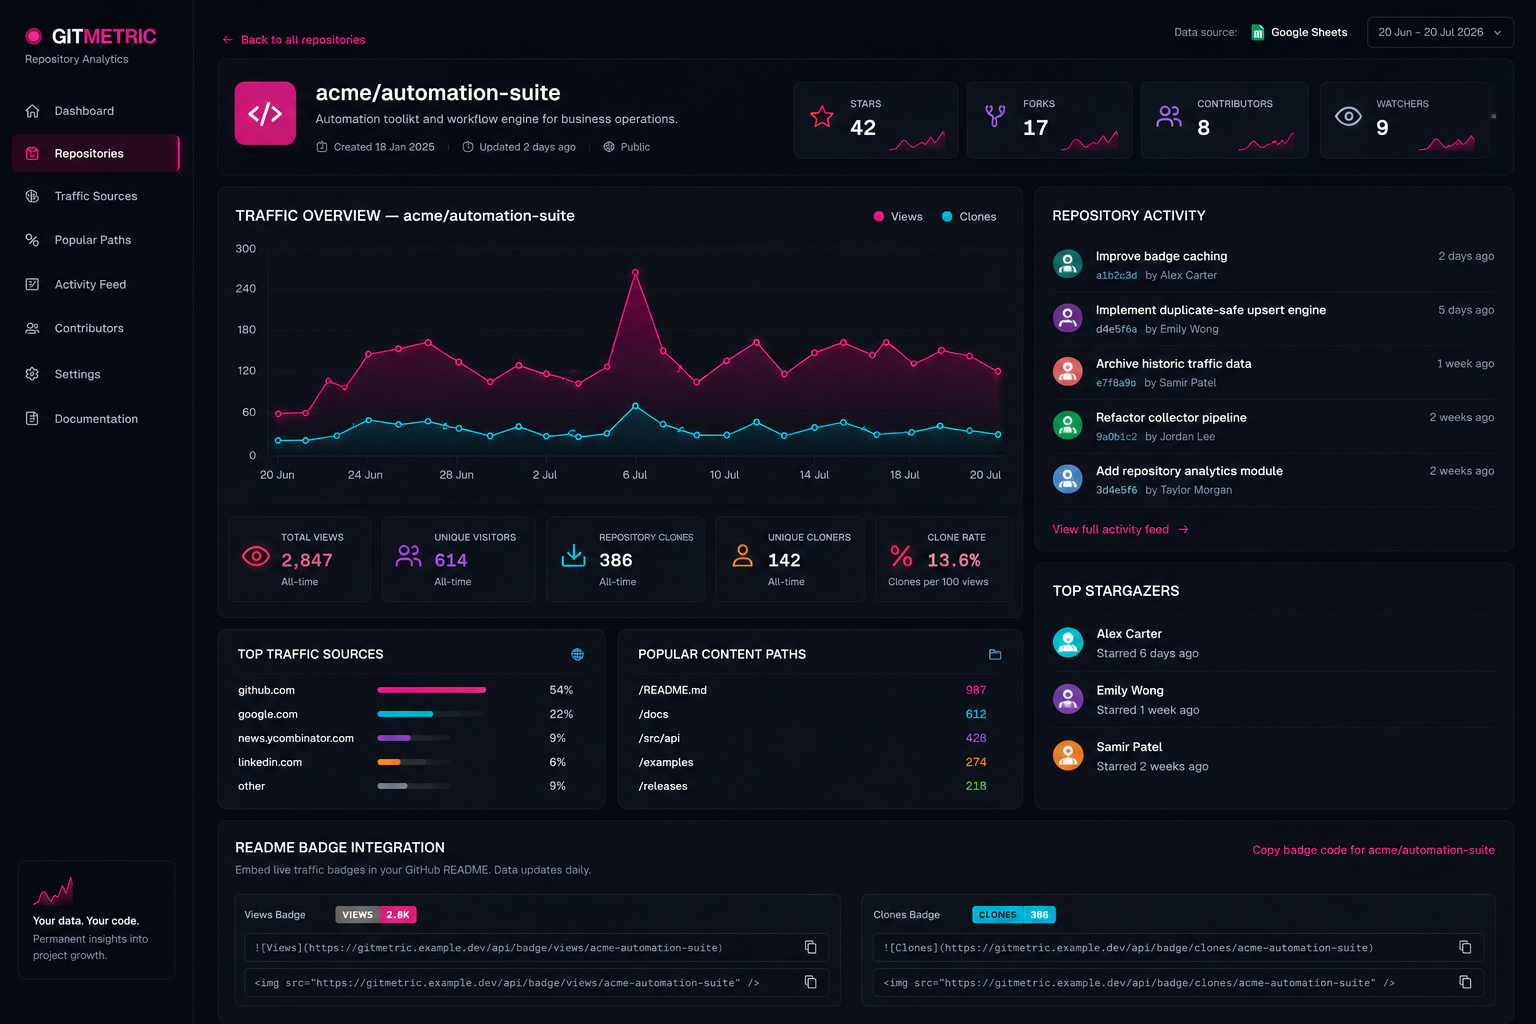
Compare total page views with distinct visitors to understand both reach and repeat interest.
See how often the repository was downloaded and how many distinct cloners were involved.
Identify whether discovery came from GitHub, search engines, social platforms, articles or community links.
Understand which repository pages, files or routes attracted the most attention.
Explore stargazers, contributors and forks with repository-specific context.
Bring recent commits, pull requests and issues into the same project view as the archived traffic history.
Architecture decisions
There are many valid ways to build a repository analytics platform. GitMetric deliberately chooses an architecture that optimises for simplicity, ownership, transparency and low operating cost rather than maximum theoretical scalability.
This is a conscious engineering decision, not a technical limitation.
There is rarely one universally correct architecture. There is usually a most appropriate architecture for a project’s scale, budget and operational requirements.
Design decision
GitMetric records a modest amount of structured, append-oriented data. For each tracked repository, the main archive contains one row per date with a small set of numeric traffic values.
The project does not require high-frequency writes, financial transactions, complex joins, strict multi-user tenancy or millions of concurrent queries. It performs one scheduled collection cycle per day across a small portfolio of repositories.
At that scale, Google Sheets provides enough capacity while adding several practical benefits.
Every stored row is visible in a familiar interface. The owner can inspect dates, verify values and use native version history without a specialist database client.
The archive can be exported as CSV, copied, backed up or connected to another reporting tool without proprietary lock-in.
The raw historical data remains in a spreadsheet owned by the developer rather than inside an external analytics SaaS product.
The intended personal-project workload can run without paying for a dedicated database service or maintaining additional infrastructure.
A problem can be investigated directly from a phone or browser. There is no need to open PgAdmin, run a SQL client or restore a database dump just to inspect the archive.
The persistence technology remains aligned with the actual size and risk of the system instead of optimising for a scale the project does not currently have.
Google Sheets is not being presented as a replacement for every database. It is being used because it satisfies this project’s requirements at the lowest sensible level of complexity.
Trade-off
Google Sheets is not indexed like a relational database. Large, selective queries are less efficient, and applications may need to retrieve a wider range before filtering records in memory.
It also has API quotas and is not designed for high-concurrency public workloads. GitMetric reduces that risk through scheduled collection, server-side reads and edge caching for public badges.
Manual editability is useful, but it creates a schema risk. A header can be renamed, a date can be reformatted or a numeric cell can be replaced with text. The application should therefore validate data coming from the Sheet rather than treating it as permanently pristine.
These are genuine trade-offs, but they are acceptable for the current use case: a small number of repositories, one owner, one daily write cycle and cached public outputs.
Alternative architectures
The existing implementation is one valid answer. Developers starting from scratch may reasonably choose a different persistence or execution model depending on their priorities.
Current implementation
Best for personal-scale analytics where user ownership, visibility, low maintenance and cost matter more than advanced query performance.
GitHub Actions retrieves traffic data and upserts daily records into a user-owned Google Sheet. The dashboard reads and aggregates those records server-side.
The project has one owner, a modest repository count and a strong preference for transparent, user-controlled infrastructure.
Flat-file approach
A scheduled workflow writes traffic history into a JSON file and commits the updated file back to the repository.
GitHub Actions fetches the traffic data, updates a structured JSON archive and commits it. A static site can import the file at build time or fetch it from the repository.
The tracker is entirely public, the dataset is small and minimal setup is more important than a clean repository history.
Embedded database
Traffic records are stored in a compact SQLite database file with proper tables, indexes and SQL queries.
The collector opens a SQLite file, performs an indexed upsert and stores the updated file somewhere persistent.
The application runs locally or on infrastructure with a persistent filesystem and SQL support is useful without needing a database server.
Relational database
A traditional relational database provides unique constraints, indexes, native upserts and efficient date-range queries.
The collector writes to a traffic table using a composite unique key such as repository and date. Queries return only the rows and aggregations required by the dashboard.
INSERT ... ON CONFLICT UPDATE.The system tracks many organisations, supports multiple users, requires complex analytics or is evolving into a hosted service.
Managed serverless database
Managed PostgreSQL removes much of the database administration while preserving relational capabilities.
The collector connects using a hosted database URL and writes to a managed Postgres instance. The dashboard queries the same database through server-side code or a generated API.
The project needs a credible path to multi-tenancy, advanced querying, account isolation or a public hosted offering.
Execution change
The daily collector can run as a scheduled Vercel function instead of a GitHub Actions workflow.
Vercel invokes a protected serverless route on a schedule. That route reads the GitHub API and writes to the chosen persistence layer.
The application already uses Vercel for all scheduled server-side work and consolidating execution matters more than keeping collection beside the repository.
Caching layer
A KV store can hold summary metrics or precomputed badge values close to the edge.
The collector writes the latest repository totals into key-value entries. Dashboard widgets or badge endpoints retrieve those small records with very low latency.
Fast public delivery is the main concern and a separate source of truth already exists for the full historical archive.
Hybrid read model
Google Sheets remains the source of truth while the collector also generates a static summary file for fast dashboard reads.
After updating the Sheet, the collector compiles aggregates into JSON and publishes that snapshot for the frontend.
The read workload has outgrown direct Sheet access but a full database migration is not yet justified.
The important design principle is not “use Google Sheets”. It is “choose the simplest reliable technology that matches the real workload”.
Landscape & Alternatives
GitMetric is not the only project addressing GitHub’s limited traffic retention. Hosted tools such as RepoHistory provide long-term repository analytics as a managed service, while open-source projects such as ghstats use Docker and SQLite, and GitHub Traffic Tracker uses Actions, Gists and GitHub Pages. GitMetric takes a different approach, prioritising user-owned storage, self-hosting, and customizable live SVG README badges.
SaaS Competitor
A hosted commercial service that automatically syncs and saves traffic history beyond 14 days.
Where it overlaps: Permanent views/clones history, referrer logs, visual charts, and automatic daily sync.
Where GitMetric differs: Self-hosted, free, user-owned raw data (stored in your Google Sheets), and includes customizable live SVG README badges.
"RepoHistory offers the hosted-service version of this idea. GitMetric offers the self-hosted, user-owned version."
Open Source Alternative
A self-hosted Docker and SQLite application that runs synchronisation tasks to pull repository stats.
Where it overlaps: Open-source, self-hosted, multiple repository tracking, and portfolio/repo traffic totals.
Where GitMetric differs: Uses GitHub Actions scheduler and Google Sheets instead of running a permanent Docker container and SQLite database.
Serverless Gist Script
A Python script running in GitHub Actions that saves metrics in a GitHub Gist and publishes a static dashboard.
Where it overlaps: Daily Actions collector, no server databases, static hosting, and Shields.io badges.
Where GitMetric differs: GitMetric uses Google Sheets (more readable/audit-friendly than Gist JSON strings) and has a Next.js frontend with customizable SVG charts.
| Product | Deployment Model | Persistence Layer | Traffic Retention | Dynamic Badges | Main Strength |
|---|---|---|---|---|---|
| GitMetric | Self-hosted (Serverless) | User's Google Sheet | Lifetime Archive | Yes, Custom SVG | Full user ownership, portfolio-focused |
| RepoHistory | Hosted SaaS | Provider-managed | Lifetime Archive | Limited embeds | Lowest setup friction |
| ghstats | Self-hosted (Docker) | Local SQLite file | Lifetime Archive | No | Compact self-contained deployment |
| Repo Analytics | Hosted Platform | Provider-managed | Lifetime Archive | No | Additional audience demographics |
| GitHub Traffic Tracker | Self-hosted (Actions) | Gist JSON string | Lifetime Archive | Yes, Shields.io | Zero database server dependencies |
| GitHub Native Insights | GitHub Portal | Temporary data cache | 14 days only | No | Zero configuration required |
Technical Overview
A visual overview of the platform’s major components and engineering decisions.
Technical specification
The following specification documents the major data structures, runtime behaviour, visual system, security boundaries and deployment model used by the current implementation. Click each to inspect.
1. Strategic purpose
GitMetric mitigates the transience of GitHub traffic data by building a permanent archive of official repository metrics.
The goal is not to create another vanity counter. The platform preserves authenticated traffic signals that help a developer understand project discovery, adoption and long-term performance.
This transforms a profile from a static collection of code into a better-documented professional asset with a verifiable repository history.
2. Core design principle
Proportional architecture means selecting the simplest infrastructure capable of solving the problem reliably.
For personal portfolio tracking, a database-heavy stack can introduce cost, maintenance and a larger operational footprint without creating a meaningful benefit. GitMetric therefore combines serverless execution, spreadsheet persistence and edge-cached delivery.
The collector can be rerun safely because existing records are updated rather than duplicated.
Credentials are narrow in purpose and the system uses a small number of owner-controlled services.
Scheduled actions and managed hosting remove the need to administer a permanent server.
The developer owns the spreadsheet containing the raw historical archive.
3. Persistence schema
The persistence layer is structured to store time-series logs for multiple repositories inside a single flat file.
To prevent indexing complexity, the schema combines a composite key with rolling activity statistics.
Tracks views, unique visitors, clones, unique cloners, refers, and content paths over time.
Stores names and metadata of developers who starred or forked the repositories.
Tracks repository names, commit activity, contributors counts, open issues, and pull requests.
4. Collector configuration
The collection workflow is written in TypeScript and runs inside GitHub Actions.
It fetches the available traffic window and performs a duplicate-safe upsert using the Google Sheets API.
Fires once per day via a cron trigger, or manually using a workflow_dispatch configuration.
Respects GitHub API and Google Sheets API quotas by batching and scheduling calls.
Secrets are injected dynamically at runtime, keeping credentials isolated from code commits.
5. Badge API
README badges are generated dynamically by reading the persistence layer and returning an XML SVG string.
The endpoint parses repository names and metric selections, providing clean, styled graphics that embed cleanly in markdown documents.
Accepts repository names and metrics (views, uniques, clones, unique_clones) as query parameters.
Returns a clean, valid XML SVG badge string with tailored background gradients and metrics.
SVG badges adapt cleanly to light/dark themes and scale natively inside browser viewports.
6. Edge caching
To prevent repeated calls to Google Sheets from slowing down README loads, badge renders are cached on Vercel's CDN Edge.
This limits read frequency while keeping data accurate and badges highly responsive.
| Cache Directive | Value | Description |
|---|---|---|
s-maxage |
86400 (24 hours) |
Instructs Edge CDN to cache badge assets. |
stale-while-revalidate |
14400 (4 hours) |
Allows serve of stale values during background refreshes. |
7. Frontend architecture
The dashboard UI is built as a single-page application inside Next.js.
It requests data from serverless routes, client-side aggregates, and filters in real-time.
Stores active filters, search queries, selected repositories, and UI tab choices.
Loads stargazers, forks, and repository activity feeds asynchronously to speed up page load.
Reflows dashboard graphs, details tables, and activity lists cleanly on mobile viewports.
8. SVG charting
Charts are rendered as lightweight, responsive SVG elements rather than using heavy third-party JavaScript libraries.
This keeps dashboard load fast and responsive without bloated bundles.
Calculates coordinates and generates visual line graphs and bar charts dynamically.
Uses viewBox and percentage attributes to scale graphs naturally inside different panel grids.
Applies glowing HSL color gradients and stroke properties under graph paths.
9. Progressive web app
The dashboard includes a PWA definition and service worker, allowing users to install the app on their devices.
Offline caching keeps assets available and speeds up repeated visits.
Declares theme colors, app icons, names, and starting URL configurations.
Intercepts network fetches, caching static CSS, JS, and app assets for offline speed.
Removes browser URL bars and navigation chrome when launched from the device home screen.
10. Security model
The architecture is designed to prevent credentials, sheets data, or private tokens from leaking to public users.
Sensitive environment variables never reach the client bundle.
Credentials are consumed only inside Vercel's serverless routes, far from the public client.
Tokens and account JSONs are configured as environment variables and stay out of Git.
Dynamic badge endpoints retrieve statistics and format XMLs without exposing source URLs.
11. Environment variables
The project requires three private environment variables, which must be configured on both the GitHub Action runner and the Vercel deployment.
| Variable | Destination | Description |
|---|---|---|
GOOGLE_SERVICE_ACCOUNT_CREDENTIALS |
Vercel & GitHub Actions | The service account credentials JSON string. |
GOOGLE_SHEETS_SPREADSHEET_ID |
Vercel & GitHub Actions | The spreadsheet ID found in the browser URL bar. |
GITHUB_TOKEN / TRAFFIC_PAT_TOKEN |
Vercel & GitHub Actions | GitHub credentials to query repository metrics. |
12. Deployment model
GitMetric is deployed on Vercel. Next.js serverless functions respond to API requests while static assets are delivered via the Edge CDN.
Compute runs dynamically when querying referrers, stargazers, forks, or badge SVG definitions.
Static pages, manifest icons, and script files are delivered globally via Vercel's Edge nodes.
Saves dynamic reads against the Sheets API, rendering badges fast for public view.
Security and open-source behaviour
A public fork receives the generic application code. It does not receive the original owner’s credentials, spreadsheet identifier or tracked repository list.
GitMetric is designed so deployment-specific values remain outside the source code.
Local values are stored in environment files that are excluded from Git. GitHub Actions uses repository secrets, and Vercel uses private environment variables configured inside the deployment.
When another developer clones or forks the repository, the codebase cannot access the original Google Sheet or GitHub traffic. The new owner must create their own spreadsheet, provide their own service-account credentials, generate their own GitHub token and define their own tracked repositories.
Forks do not receive the original repository’s configured secret values.
The service-account credentials and spreadsheet identifier remain private to the original deployment.
Repository names are supplied dynamically through the environment rather than hardcoded into the public source.
Each fork becomes a clean installation that must be connected to the new owner’s own GitHub and Google infrastructure.
Open-sourcing the application shares the software, not the original owner’s data.
Self-hosting guide
The installation has four main stages: create the persistence layer, authorise GitHub access, configure private secrets and deploy the dashboard. Click a tab below to walk through the instructions.
Create a new Google Sheet that will hold the permanent traffic archive.
In Google Cloud Console, create or select a project, enable the Google Sheets API, and create a service account for GitMetric.
Generate the service-account JSON credentials and store them securely. Copy the service-account email address, and share the Google Sheet with that account as an Editor.
Engineering note
The service account needs access to the selected spreadsheet, not the developer’s entire Google Drive.
Create a GitHub token (Classic PAT or Fine-grained token) that can read traffic for the repositories being tracked.
Traffic endpoints are restricted to repository owners and require appropriate repository access. Permissions should be kept as narrow as the chosen token type and required endpoints allow.
Store the token securely. Do not add it to the codebase, commit it to an environment file, or place it in public documentation.
Open the repository’s Settings -> Secrets and Variables -> Actions page and add the configuration required by the collector.
| Secret Name | Value Description |
|---|---|
TRAFFIC_PAT_TOKEN |
The GitHub Personal Access Token generated in Step 2. |
GOOGLE_SERVICE_ACCOUNT_CREDENTIALS |
The complete service-account JSON credential string. |
GOOGLE_SHEETS_SPREADSHEET_ID |
The identifier found in the Google Sheet URL. |
TRACKED_REPOSITORIES |
A comma-separated list of repos (e.g.
owner/repo-one,owner/repo-two).
|
Once the workflow runs, the collector validates the repository list, fetches the available traffic window, and creates or updates the corresponding Sheet rows.
Import the repository into Vercel and configure the same Google credentials and spreadsheet identifier inside the Vercel environment variables.
Add a GITHUB_TOKEN environment variable if the live repository panels require
server-side access to commits, contributors, stargazers, forks,
issues, pull requests or other GitHub context.
Deploy the application. Vercel will host the Next.js dashboard, server-side routes, PWA cache files, and badge endpoint.
Use the deployed badge endpoint with the repository and selected metric parameters:

Repeat the badge with uniques, clones or
unique_clones to display another metric.
Future Operations: Tracking New Repositories
To track a new project in the future, append it to the TRACKED_REPOSITORIES secret on
GitHub and add the badge code to its README. To see it in your dashboard immediately without waiting for
the midnight scheduler, go to the Actions tab of your GitHub tracker repository and
trigger the Collect Traffic Data workflow manually using the Run
workflow button.
Operational considerations
Review failed GitHub Actions runs and ensure one unsuccessful day does not continue unnoticed.
Protect Sheet headers and validate that dates and numeric values remain in the expected format.
Replace revoked or expired tokens and update both GitHub and Vercel environments when credentials change.
Confirm that public badges remain responsive and that cache headers prevent unnecessary repeated reads.
Reconsider the persistence layer if the installation grows from a handful of repositories into a large organisation or multi-user service.
Monitor GitHub, Google and Vercel documentation for changes to endpoints, permissions, quotas or platform behaviour.
Frequently asked questions
It can capture the trailing history still available through GitHub at the time of the first run. It cannot recover records that have already left GitHub’s rolling retention window.
GitHub’s newest traffic values can change while backend processing is still settling. Refetching the window allows recent rows to be corrected automatically.
No. The upsert logic uses repository and date as the unique record key. Matching rows are updated and only new dates are appended.
No. It is used because the current workload is small, scheduled, owner-operated and easy to represent as structured daily rows. A larger multi-user product would likely benefit from PostgreSQL or another database.
It can track repositories that the configured GitHub token is authorised to access, provided the traffic endpoints and token permissions support the required repository.
No. The fork receives the source code only. Secrets, environment variables, spreadsheet identifiers and tracked repository lists must be supplied independently by the new owner.
The source metrics are daily and already delayed. A six-hour cache keeps badges fast and protects the persistence layer without materially reducing usefulness.
Yes. Vercel Cron is a valid alternative. GitHub Actions was selected because the automation is repository-centric and benefits from living beside the code and its secrets.
To protect visitor privacy, GitMetric does not store cookies, IP addresses, or tracking identifiers. Since we only save anonymous daily aggregates (e.g. "1 unique view today"), the dashboard calculates totals by summing these daily uniques over time. Therefore, if the same person visits your repository on four different days, it will show as 4 unique visitors accumulated over that period rather than 1 de-duplicated individual.
Beyond the star count
Stars are visible, but they are also shallow. A stronger repository history includes the people who visited, the codebases that were cloned, the domains that referred traffic and the way interest changed over months rather than days.
GitMetric preserves that story without turning a personal analytics project into an unnecessarily complex platform.
GitHub shows the last fourteen days. GitMetric preserves the rest of the project’s lifetime.